Goal[]
We wanted to test beaconing APRS position on a custom (non-Internet linked) frequency every 6 seconds. In addition we had a lighter payload to try and break the 100,000ft barrier.
Flight[]
You can view the flight on aprs.fi.
Contents[]
- One 800 g balloon from scientificsales.com (I like these balloons).
- Our standard funchute that we have used for the last four launches.
- One pod consisting of

Bionics Micro-Trak RTG units are powered by eight Lithium batteries and share a GPS unit.
- Canon PowerShot SD1000 running CHDK (Canon Hack Development Kit) and intvl-nolimit.txt script.
- Byonics Micro-Trak RTG NA
- Byonics Micro-Trak RTG FA High Altitude Combo
- SPOT II GPS Satellite Messenger
Fill[]
The balloon was filled in a hanger at Martin Airfield in College Place, WA. This kept the balloon out the wind during the fill making it easier to work with and allowing us to calculate the upward force of the balloon without any wind pushing on the balloon, effecting the force reading. We used a Vernier LabQuest with a force sensor to make the measurement. All 135 cu ft was put into the balloon. We measure around 30N of force from that.
Launch[]
The balloon was launched a exactly 2:12:00pm local time from Martin Airfield. To launch we tied a string around the balloon and let the payload rise intill we were sure the balloon could lift it. Then we lowered the balloon, removed the string, and slowly let the balloon rise by holding on the lines connecting the pod and paracheute. To launch we simply let go of the last pod.
Burst[]
The highest position we received was 107,110ft, 7 km NW of Lacrosse, WA. This was 2 hours 14 minutes after launch.
Landing[]
The balloon landed at approxomitly 5:04pm local time at the south end of Rock Lake, 10 km WNW of St. John, WA. The resulted in a total flight time of 2 hours 52 minutes.
Analysis[]
Tracking[]
Our primary tracking, the APRS on 144.31 was transmitting every six seconds as expected but the packets did not seem to be decode most of the time, so we do not have this data. The next day we tested it and it appeared to be working. We knew there may have been a problem at launch and should have cycled power on the APRS transmitter.
Our secondary tracking, APRS on the standard 144.39, worked well. Only two packets above 1000 m were missed.
Our third level tracking, SPOT, worked perfectly. The advantage of SPOT is that the location of the balloon after landing will be on the internet. The disadvantage is that it only transmit every 10 minutes, it does not transmit altitude, and it does not transmit over 40 something thousand feet.
The lifting force from the balloon on the ground was 10-12 Newtons. We could probably reduce this by adding less helium and have a longer flight time. Ascent rate was between 3.3 - 5.0 m/s. Descent rate was measured to be about 50 m/s just after burst, but slowed to 15 m/s at 20,000 m. At landing the descent rate was about 6.5 m/s (1300 fpm). This is more than I expected. The lines holding the balloon were tangled into the parachute lines. These lines will be shortened for the next launch.
Flight Pictures[]
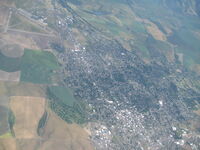
A Canon Powershot camera was sent up to take pictures about every 20 seconds. It was pointed out the side of the pod angled slight down. Anti fog wipes from the eye doctor were used to keep the lens from fogging. It recorded the entire flight but the battery died before we could recover it.
Download Pictures (zipped jpg 500MB)
Prediction[]
From weather.uwyo.edu the path prediction


